
Tuesday, May 19, 2015


Monday, May 18, 2015

Week 17b - Updating an existing logo task 1
 https://s-media-cache-ak0.pinimg.com/originals/44/8f/6a/448f6a01001de3f1c6e7b91e70a62fee.jpg
 http://kes.wimp.com/images/sthumbs/2015/04/3dd5ec0253ad143a4f661050eaafe163_lo5.jpg
 http://vanimg.s3.amazonaws.com/good-logos-5.jpg

https://lh3.googleusercontent.com/mNSelLauA2_IcgU9AM7PQXvRfJwaVyXbbJBk3TJHOnk-hVieEQOhZqwMYIsnXpG49_jBw=s8
Tuesday, May 12, 2015


Tuesday, May 5, 2015

Week 16a Information Graphics Design
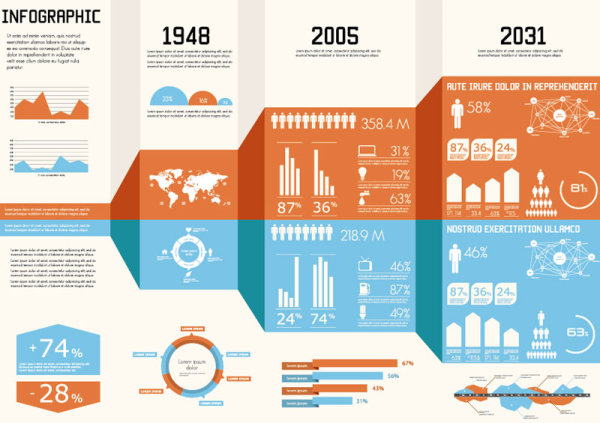
Information graphics or infographics are graphic visual representations of information, data or knowledge intended to present complex information quickly and clearly. They can improve cognition by utilizing graphics to enhance the human visual system’s ability to see patterns and trends.The process of creating infographics can be referred to as data visualization, information design,
Infographics appeared in the form of illustrations demonstrating the Sun’s rotation patterns.Data visualizations are often used in infographics and may make up the entire infographic. There are many types of visualizations that can be used to represent the same set of data. Therefore it is crucial to identify the appropriate visualization for the data set and infographic by taking into consideration graphical features such as position, size, shape, and color. There are primarily five types of visualization categories – time-series data, statistical distributions, maps, hierarchies, and networkinginformation architecture.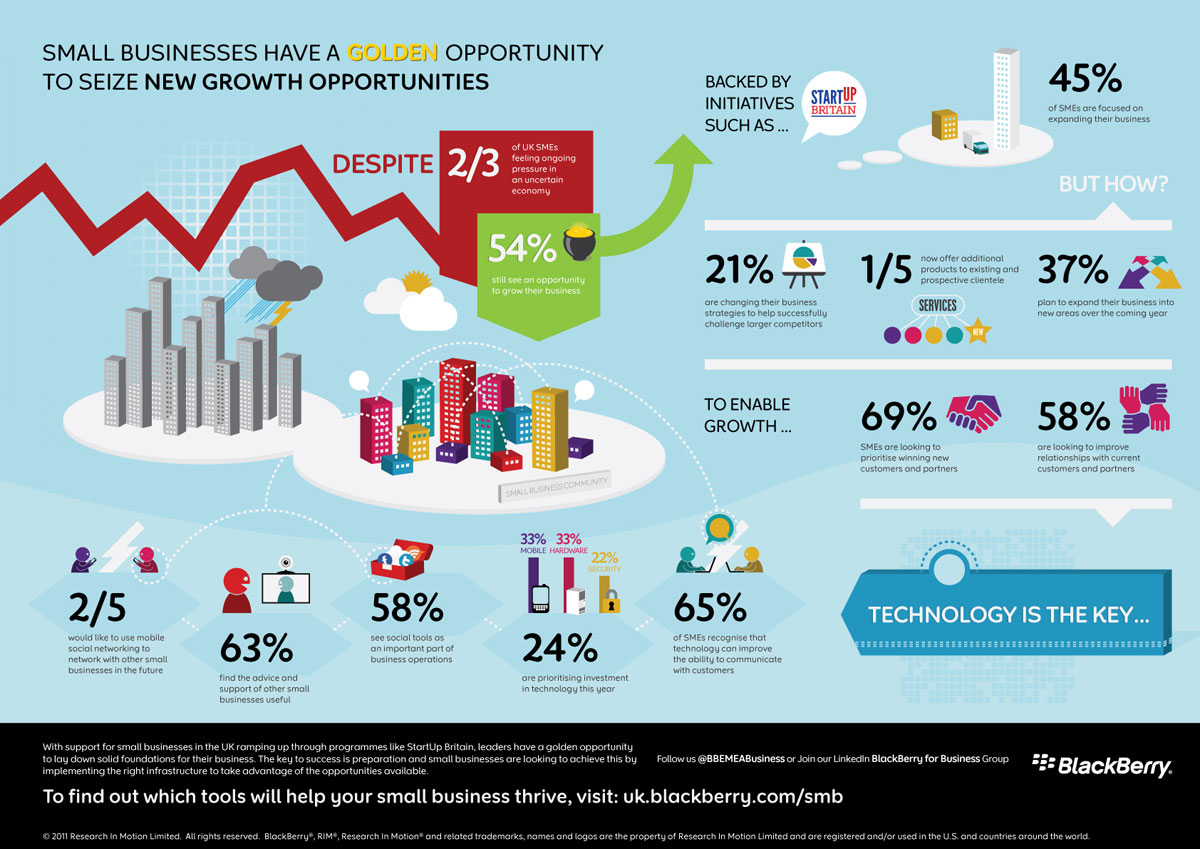
this shows the rates of small businesses
http://www.oneworldoneocean.com/images/blog/OWOO_PlasticsInfographic_2012_b.jpg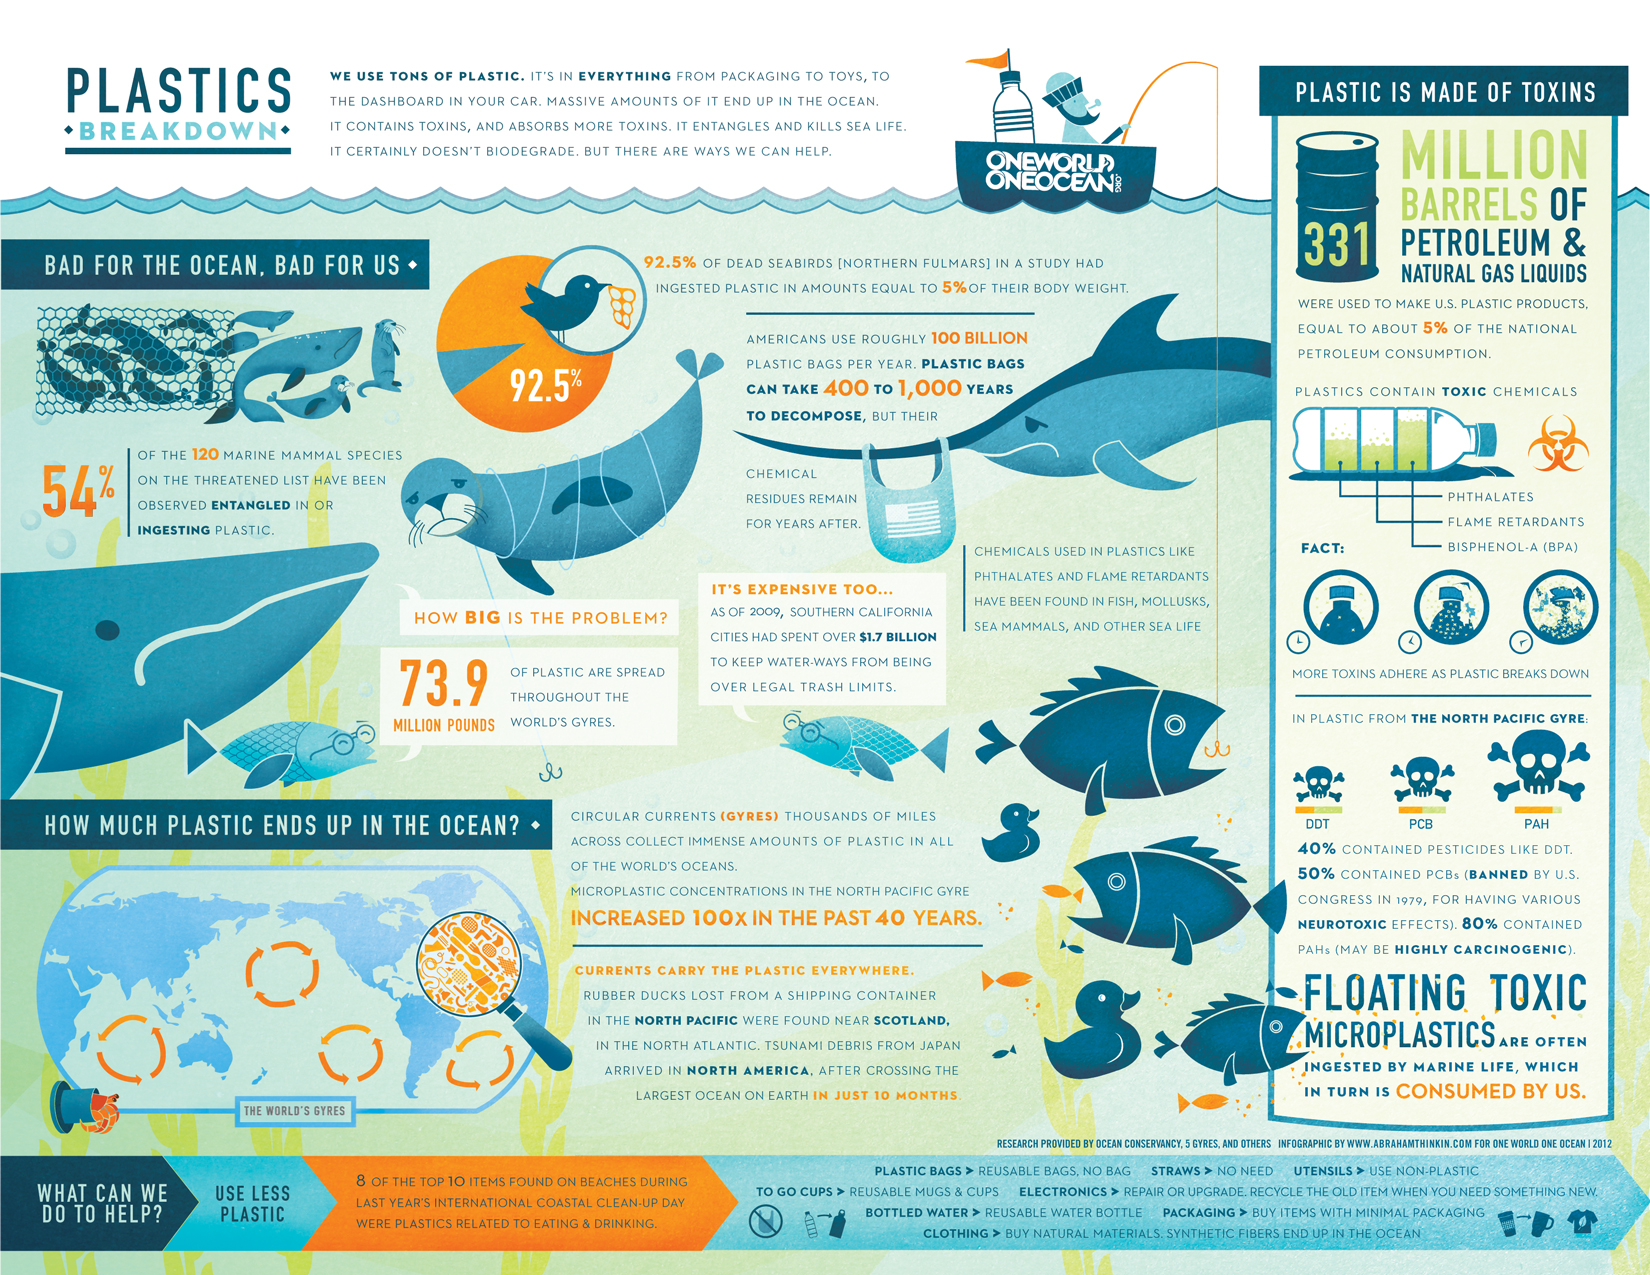
this shows the plastic breakdowns
http://www.prnewsonline.com/Assets/Image/BlackBerry%20SMB%20Infographic.jpg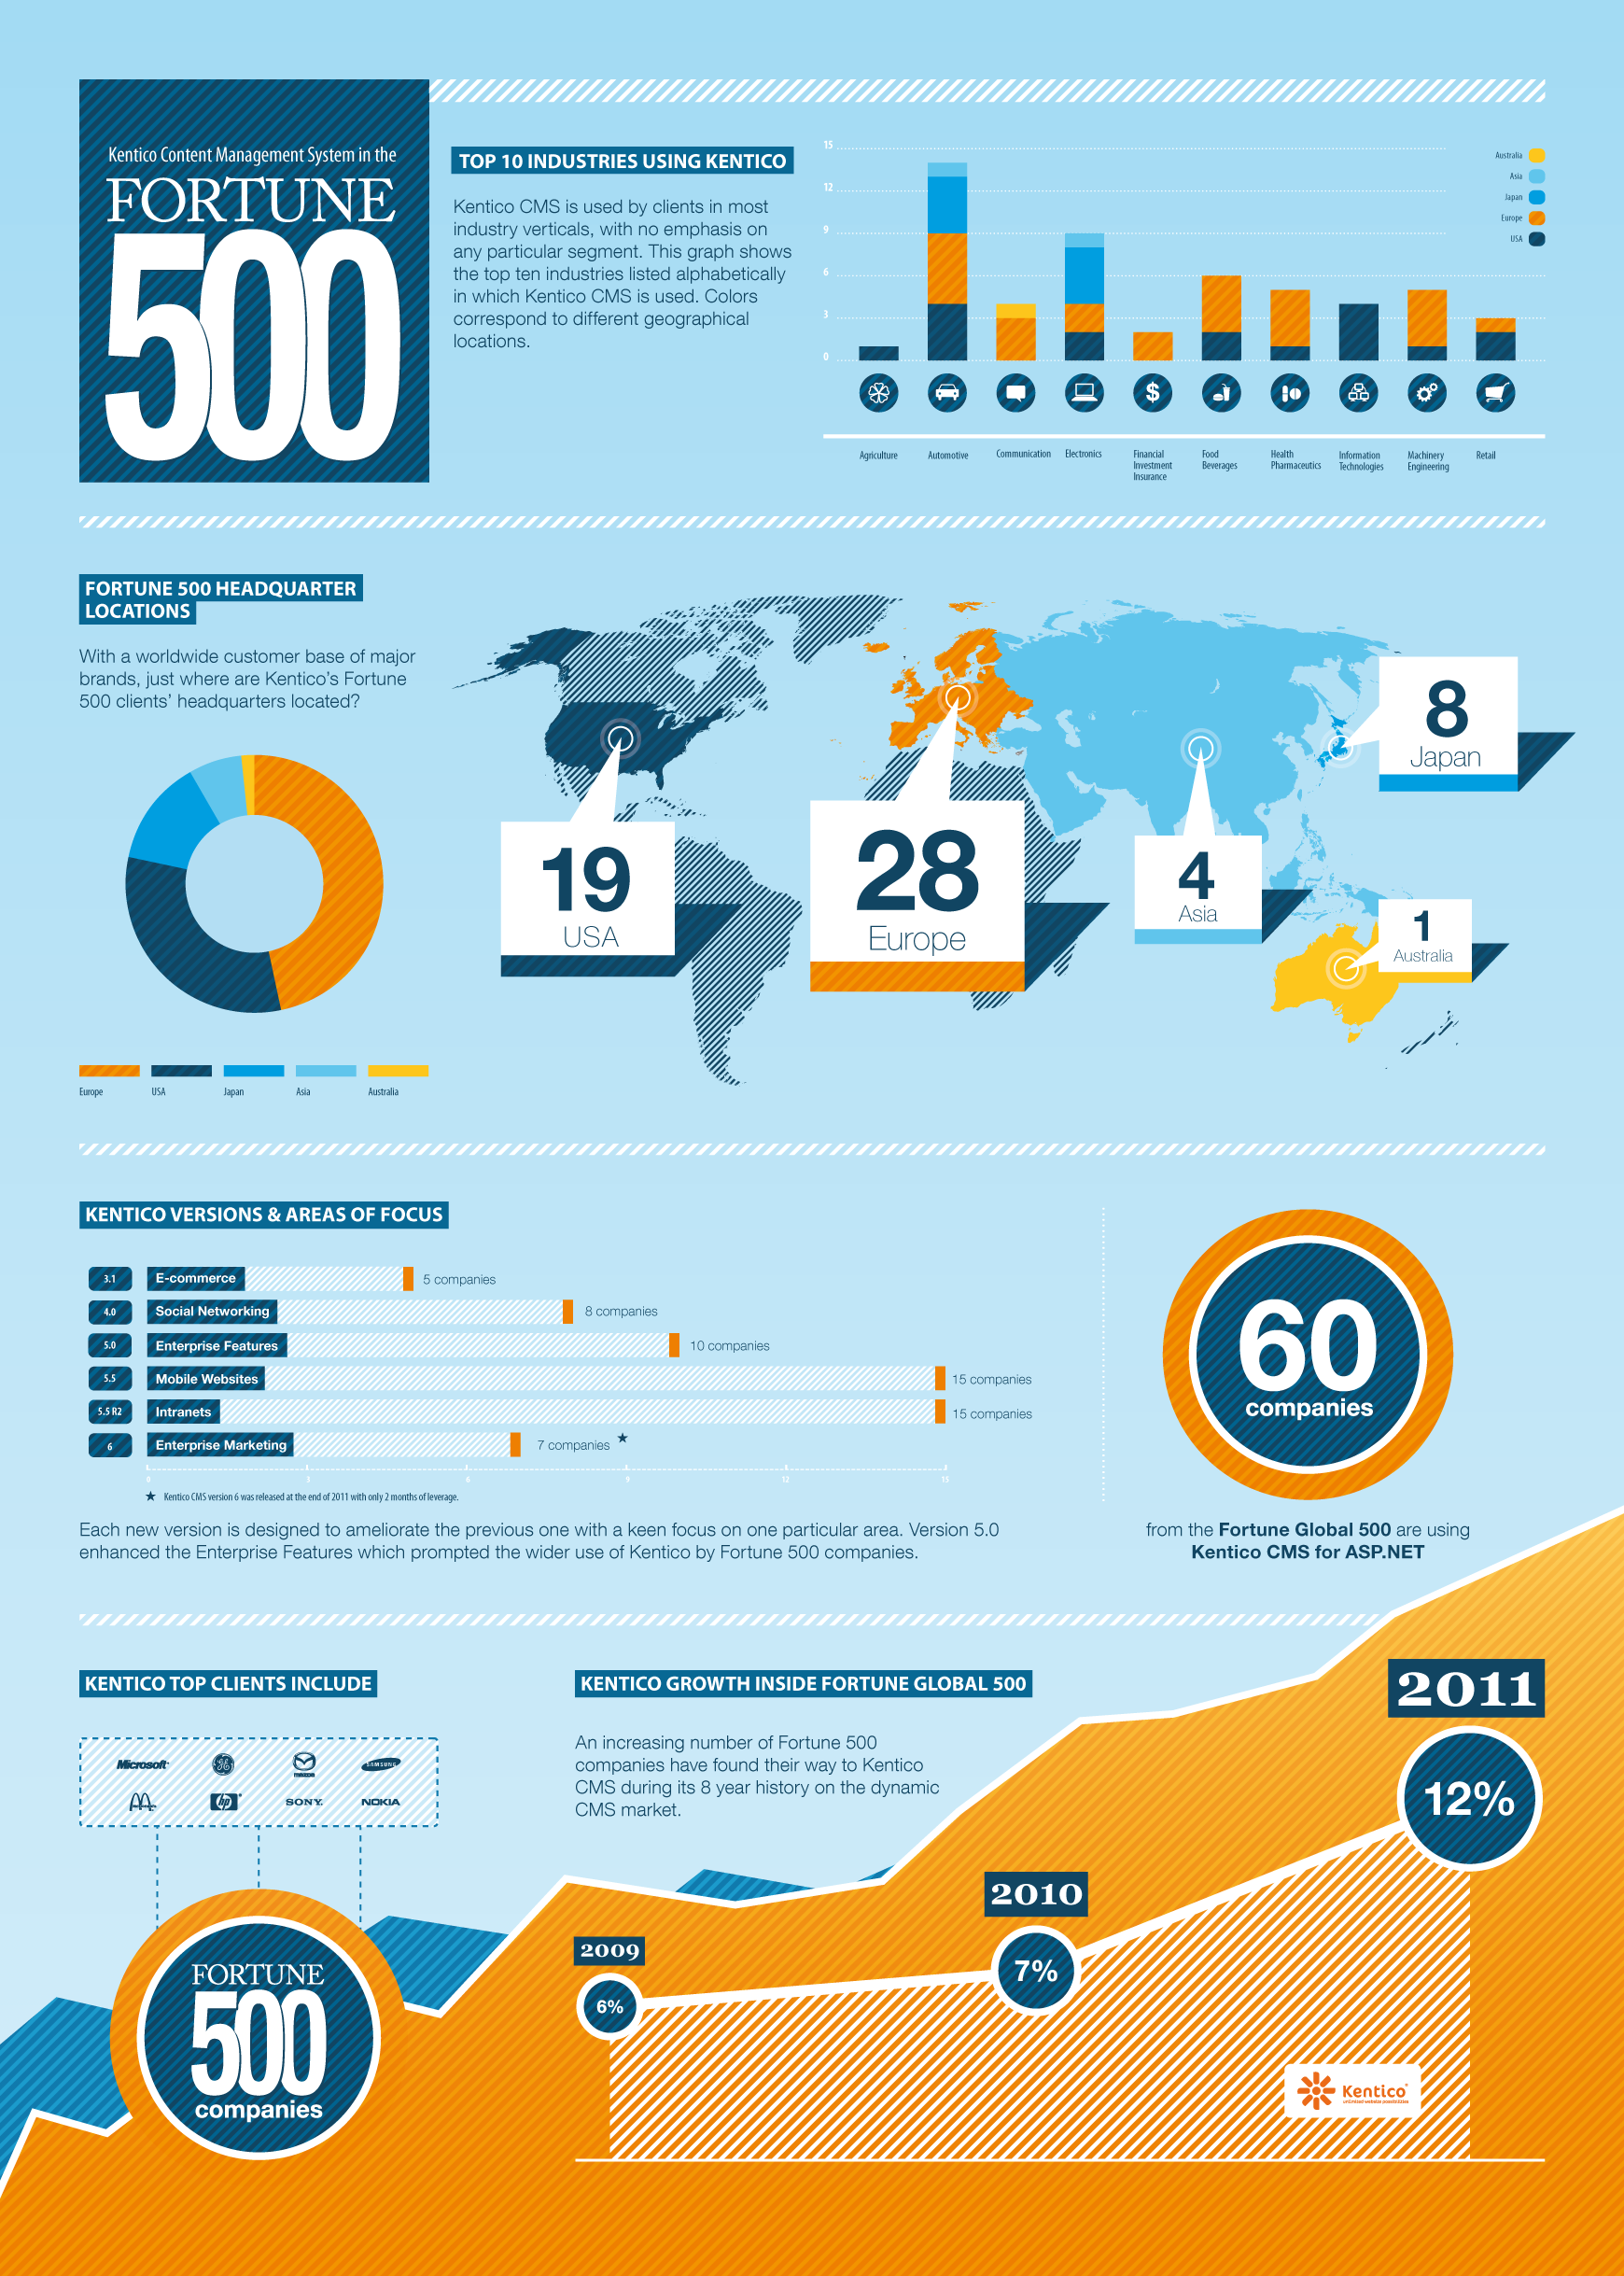
this shows the fortune around the world
http://devnet.kentico.com/getattachment/fd511a92-e164-40f5-ba51-07c228a49fed/Kentico_fortune500_infographics_FINAL.png
http://freedesignfile.com/upload/2012/07/002249f8_medium38.jpg
http://infographiclist.files.wordpress.com/2011/09/infographic.png
http://www.dailystatistic.com/wp-content/uploads/2013/04/apia-rise-of-the-silver-surfers-infographic.png
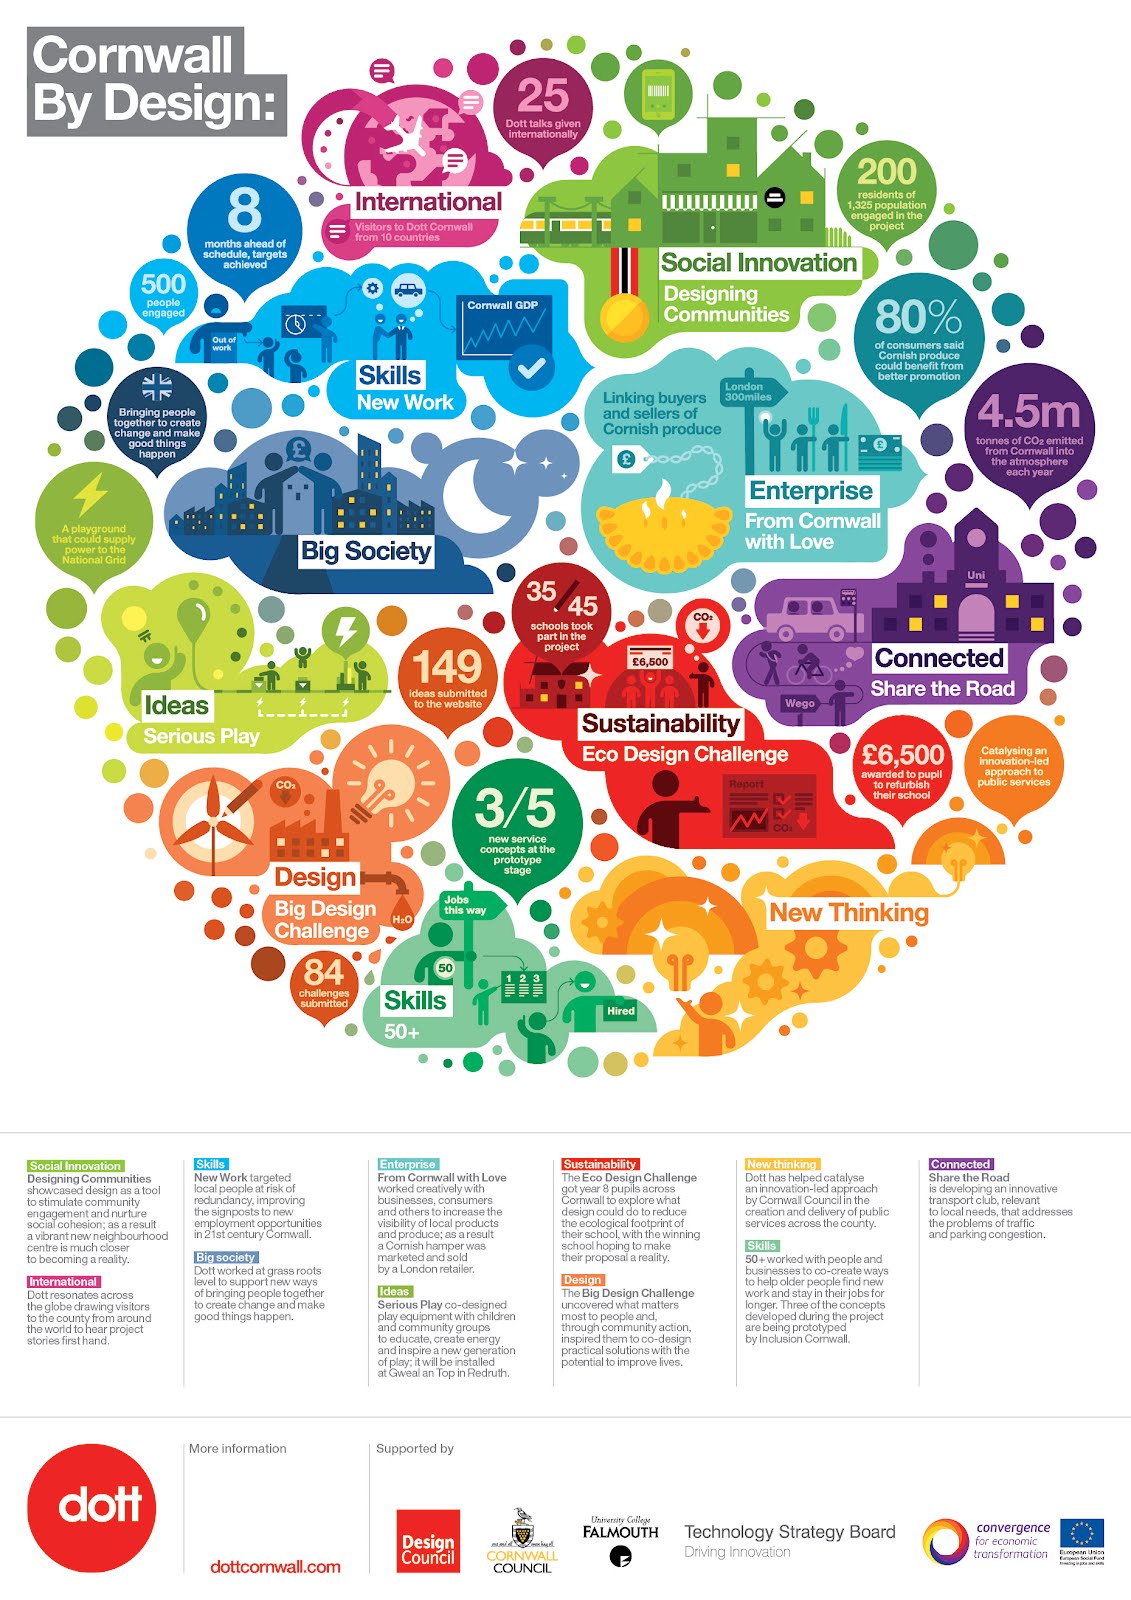
http://ceblog.s3.amazonaws.com/wp-content/uploads/2012/02/dott_infographic.jpg
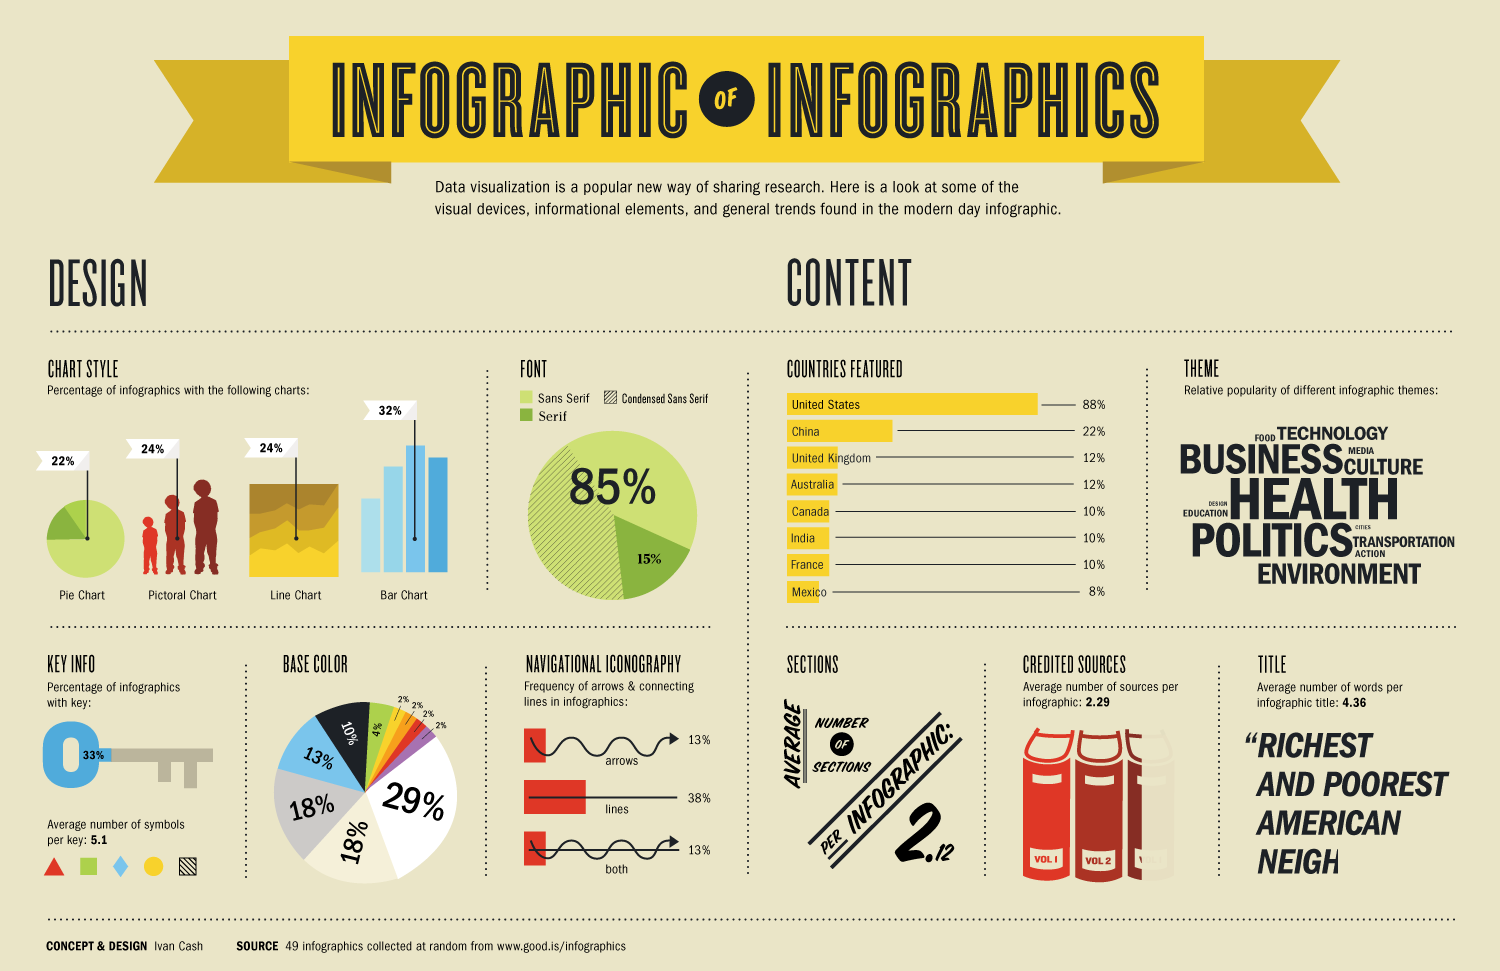
http://cdn.qunb.com/uploads/295090/Infographic_of_infographic_2.png
http://media.creativebloq.futurecdn.net/sites/creativebloq.com/files/images/2012/08/paralympicsaa.jpg
http://www.millerbusinesscenter.org/wp-content/uploads/2014/12/good-infographic.png
Subscribe to:
Comments (Atom)